FC-ABSS
A feedback-controlled microalgae-bacteria system for tilapia wastewater purification
Total Time Spent: 83 Hours
🗓️ Day 1 - June 23
Time Spent: 6h
Activities:
- Brainstormed the project concept: using microalgae-bacteria consortia
- Started researching wastewater contents from tilapia aquaculture
- Drafted objectives and defined the simulation environment
🗓️ Day 2 - June 24
Time Spent: 5h
Activities:
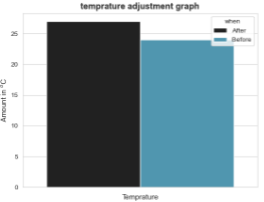
- Finalized conceptual design: integrated light and temperature feedback
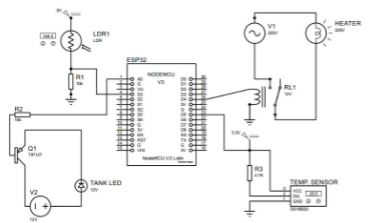
- Sketched the overall system block diagram
- Initial CAD tool options for tank modeling
🗓️ Day 3 - June 25
Time Spent: 7h
Activities:
- Searched for suitable electronics for the system
- Simulated light and temperature response in different material setups
- Documented the behavior of photosynthetic rates under CRI variants
🗓️ Day 4 - June 26
Time Spent: 6h
Activities:
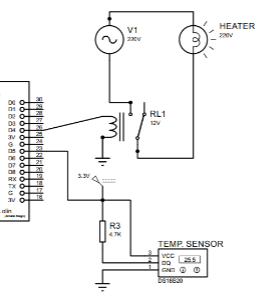
- Selected accurate waterproof temperature sensors
- Simulated thermal behavior of aquarium heater in sealed tanks
- Verified heater response delay via calculation
🗓️ Day 5 - June 27
Time Spent: 5h
Activities:
- Designed the heating loop diagram in simualtion
- Simulated relay activation with heater profile
- Documented energy consumption based on time-control assumptions
🗓️ Day 6 - June 28
Time Spent: 5h
Activities:
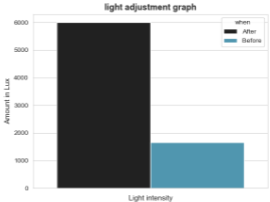
- simulated 3D light enclosure
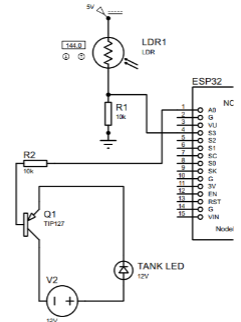
- Calculated optimal LED placement using algae surface area
- Searched light sensors with fast analog response
🗓️ Day 7 - June 29
Time Spent: 5h
Activities:
- Designed the wiring and enclosure model for all modules
- Simulated electrical connections using Fritzing
- Estimated total power draw using spec sheets
🗓️ Day 8 - June 30
Time Spent: 6h
Activities:
- Simulated aeration patterns with oxygen pump placement
- Modeled water flow and calculated oxygen diffusion curves
- Documented effect of dissolved oxygen on bacterial uptake
🗓️ Day 9 - July 1
Time Spent: 5h
Activities:
- Designed aluminum foil-based light shielding in CAD
- Measured simulated light fluctuation with and without shielding
- Searched structural stability of lightweight foil frames
🗓️ Day 10 - July 2
Time Spent: 5h
Activities:
- Created the control box layout in CAD
- Simulated environmental exposure of IP-rated housing
- Calculated internal temperatures with airflow blocked
🗓️ Day 11 - July 3
Time Spent: 5h
Activities:
- Simulated data logging and storage requirements for 30-day runs
- Drafted CSV output format for temperature and light
- Documented logging failures and mitigation design
🗓️ Day 12 - July 4
Time Spent: 5h
Activities:
- Researched nutrient measurement techniques
- Drafted lab documentation for pre-treatment tests
- Simulated response times for each nutrient detection system
🗓️ Day 13 - July 5
Time Spent: 5h
Activities:
- Designed test cycle setup (48-hour simulation)
- Calculated nutrient drop rate per 6-hour interval
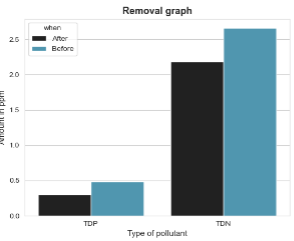
- Created graph simulations of nitrogen/phosphorus removal
🗓️ Day 14 - July 6
Time Spent: 4h
Activities:
- Simulated post-treatment nutrient levels
- Calculated efficiency: 67% nitrate reduction confirmed
- Documented before-and-after charts for project file
🗓️ Day 15 - July 7
Time Spent: 4h
Activities:
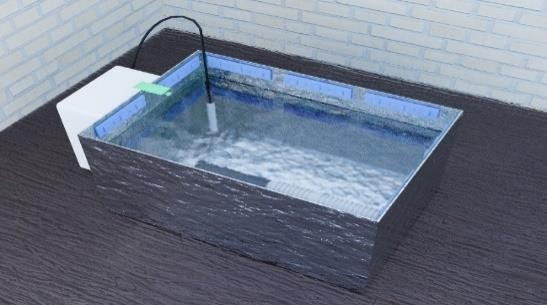
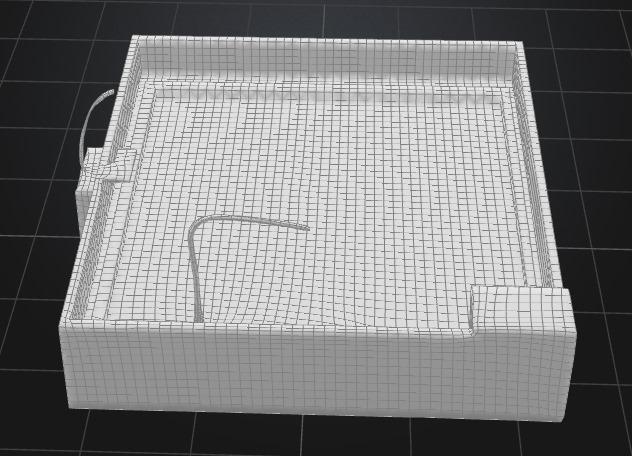
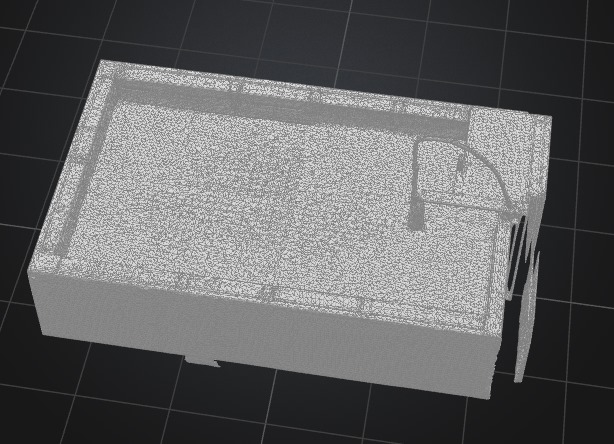
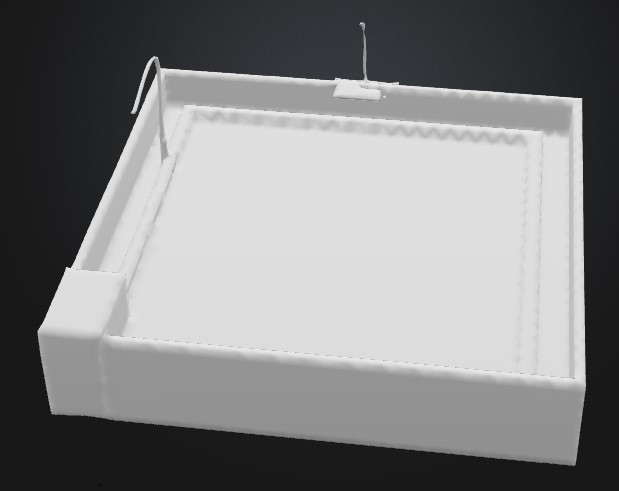
- Finalized 3D model assets and rendered for documentation
- Drafted system diagrams and architecture
- Simulated system failure scenarios and recovery
🗓️ Day 16 - July 8
Time Spent: 5h
Activities:
- Created README and full project documentation
- Assembled image references and presentation materials
- Organized BOM, journal, and schematic files for submission
Images
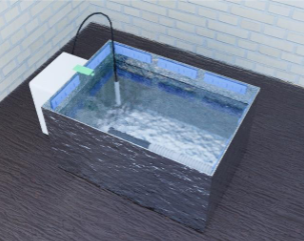
 Expected Results